
Netflow, Sampling-Interval and the Mythical Internet Packet Size
You can find more content related to NCS5500 including routing memory management, VRF, URPF, ACLs, following this link.
Introduction
In this post, we will try to clarify key concepts around Netflow technology and potentially correct some common misconceptions. Particularly we will explain why the “what is the sampling-rate you support?” is not the right question.
We will describe in extensive details the NCS5500 implementation too.
Also, we will share what we measured in different networks in Europe and North America. This information will be helpful to understand the parameters of this equation.
We will provide tools to answer questions like:
- how many new flows per second?
- how long the flows exist and how long a representation of them will stay in cache?
- are we dropping samples because of the protection shaper?
It’s certainly not meant to be a state-of-the-art but more an invitation to comment with your own findings.
To understand the basic of the technology, we invite you to start with Xander’s post on Cisco supportforum. It has been written for ASR9000 five years ago, so multiple differences exist, but it’s still a very good resource to get familiar with Netflow.
NCS5500 internals
NCS5500 supports NetFlow v9 and IPFIX (not sFlow or former versions of Netflow).
Netflow is used to create a statistical view of the flow matrix from the router or line card perspective.
In a chassis, Netflow activities will be performed at the line card level and will involve the NPU (for instance Qumran-MX, Jericho or Jericho+) and the Line Card CPU. Aside from the configuration and show commands, nothing will be performed at the Route Processor level.
Before jumping into the Netflow specifics, let’s describe some key internal parts of an NCS5500 line card or system.
Two internal “networks” exist and interconnect the various elements:
- the EOBC network (for “Ethernet Out-of-Band Channel” used for inter-process communication
- the EPC network (for “Ethernet Protocol Channel”) for all the punted packets.
Note: the fixed-form systems like NCS5501(-SE), NCS55A1-24H, NCS55A1-36H(-SE)-S, we don’t have similar internal design, you will not be able to use the “admin show controller switch xxx” CLI. It’s valid for NCS5504, NCS5508 and NCS5516 chassis but also for NCS5502(-SE) systems.
sysadmin-vm:0_RP0# show controller switch reachable

Rack  Card  Switch---------------------
0     SC0   SC-SW
0     SC0   EPC-SW
0     SC0   EOBC-SW
0     SC1   SC-SW
0     SC1   EPC-SW
0     SC1   EOBC-SW
0     LC1   LC-SW
0     LC2   LC-SW
0     LC6   LC-SW
0     LC7   LC-SW
0     FC0   FC-SW
0     FC1   FC-SW
0     FC3   FC-SW
0     FC5   FC-SW

sysadmin-vm:0_RP0#
The sampled packets and the netflow records will transit over the EPC network.
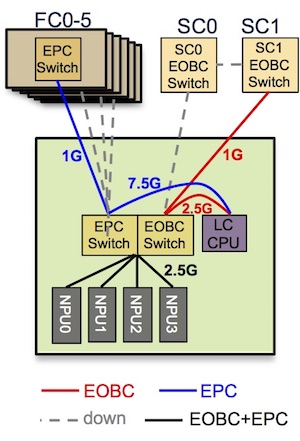
The number of NPUs and the bandwidth of EPC/EOBC channels will vary between systems.
Here is a diagram representing a line card 24x100G w/ eTCAM with 4x Jericho ASICs. Each NPU is connected at 2.5Gbps to the EPC switch and the LC CPU is connected with 3x 2.5 = 7.5Gbps to the same switch:
sysadmin-vm:0_RP0# show controller switch summary location 0/LC7/LC-SW

Rack  Card  Switch  Rack Serial Number
--------------------------------------
0     LC7   LC-SW   FGE194XXXXX

      Phys   Admin  Port      Protocol  Forward
Port  State  State  Speed     State     State       Connects To
--------------------------------------------------------------------
4     Up     Up     2.5-Gbps  -         Forwarding  LC CPU (EPC 0)
5     Up     Up     2.5-Gbps  -         Forwarding  LC CPU (EPC 1)
6     Up     Up     2.5-Gbps  -         Forwarding  LC CPU (EPC 2)
7     Up     Up     2.5-Gbps  -         Forwarding  LC CPU (EOBC)
8     Up     Up     2.5-Gbps  -         Forwarding  NPU2
9     Up     Up     2.5-Gbps  -         Forwarding  NPU1
10    Up     Up     2.5-Gbps  -         Forwarding  NPU0
11    Up     Up     2.5-Gbps  -         Forwarding  NPU3
12    Down   Down   1-Gbps    -         -           FC0
13    Up     Up     1-Gbps    -         Forwarding  FC1
14    Down   Down   1-Gbps    -         -           FC2
15    Down   Down   1-Gbps    -         -           FC3
16    Down   Down   1-Gbps    -         -           FC4
17    Down   Down   1-Gbps    -         -           FC5
18    Up     Up     1-Gbps    -         Forwarding  SC0 EOBC-SW
19    Down   Down   1-Gbps    -         -           SC1 EOBC-SW

sysadmin-vm:0_RP0#
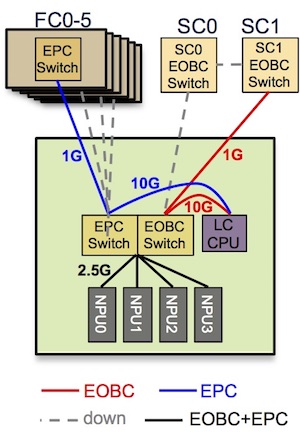
Here, we are representing a line card 36x100G w/ eTCAM with 4x Jericho+. Each NPU is connected at 2.5Gbps to the EPC switch and the LC CPU is connected at 10Gbps to the same switch:
sysadmin-vm:0_RP0# show controller switch summary location 0/LC1/LC-SW

Rack  Card  Switch  Rack Serial Number
--------------------------------------
0     LC1   LC-SW   FGE194XXXXX

      Phys   Admin  Port      Protocol  Forward
Port  State  State  Speed     State     State       Connects To
-------------------------------------------------------------------
4     Up     Up     2.5-Gbps  -         Forwarding  NPU0
5     Up     Up     2.5-Gbps  -         Forwarding  NPU1
6     Up     Up     2.5-Gbps  -         Forwarding  NPU2
7     Up     Up     2.5-Gbps  -         Forwarding  NPU3
8     Up     Up     10-Gbps   -         Forwarding  LC CPU (EPC)
9     Up     Up     10-Gbps   -         Forwarding  LC CPU (EOBC)
12    Down   Down   1-Gbps    -         -           FC0
13    Down   Down   1-Gbps    -         -           FC1
14    Down   Down   1-Gbps    -         -           FC2
15    Down   Down   1-Gbps    -         -           FC3
16    Down   Down   1-Gbps    -         -           FC4
17    Up     Up     1-Gbps    -         Forwarding  FC5
18    Down   Down   1-Gbps    -         -           SC0 EOBC-SW
19    Up     Up     1-Gbps    -         Forwarding  SC1 EOBC-SW

sysadmin-vm:0_RP0#
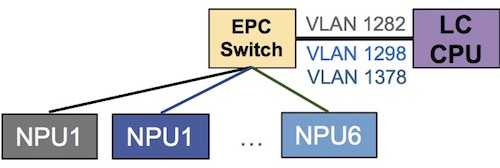
Inside the EPC switch, we have multiple VLANs to differentiate the Netflow sampled traffic coming from the various NPUs.
sysadmin-vm:0_RP0# show controller switch vlan information location 0/LC1/LC-SW

Rack  Card  Switch  Rack Serial Number
--------------------------------------
0     LC1   LC-SW   FGE194XXXXX

SDR
Identifier  SDR Name     VLAN           VLAN Use
------------------------------------------------------------------------
1           sysadmin-vm  1     (0x001)  Platform EMON
                         17    (0x011)  Platform HOST
                         3073  (0xC01)  Calvados IPC
2           default-sdr  1282  (0x502)  SDR 2 Platform Netflow 1
                         1298  (0x512)  SDR 2 Platform Netflow 2
                         1314  (0x522)  SDR 2 Platform Netflow 3
                         1330  (0x532)  SDR 2 Platform Netflow 4
                         1346  (0x542)  SDR 2 Platform Netflow 5
                         1362  (0x552)  SDR 2 Platform Netflow 6
                         1538  (0x602)  SDR 2 Platform SPP
                         1554  (0x612)  SDR 2 Platform BFD
                         1570  (0x622)  SDR 2 Platform MAC learning
                         1794  (0x702)  SDR 2 Third Party Applications
                         3074  (0xC02)  SDR 2 IPC

sysadmin-vm:0_RP0#
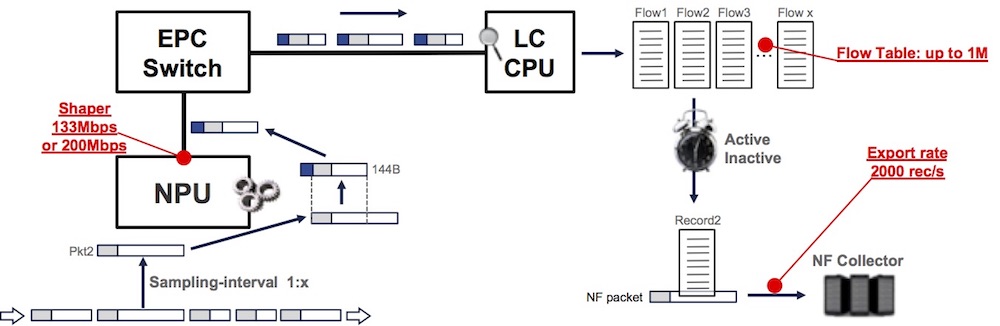
To protect the line card CPU, each NPU is shaping the sampled traffic. In chassis line cards, this shaper is configured at 133Mbps while in fixed-form platforms, it’s configured at 200Mbps. This parameter is fixed and not configurable via CLI. This NPU shaper guarantees that CPU is not overloaded while processing the samples. It’s expected to see high CPU utilization in some netflow process threads and it will not reach 100% of a CPU core.
RP/0/RP0/CPU0:R1#sh flow platform pse policer-rate location 0/1/CPU0

Npu id :0
Netflow Platform Pse Policer Rate:
Ingress Policer Rate:                     133 Mbps
Npu id :1
Netflow Platform Pse Policer Rate:
Ingress Policer Rate:                     133 Mbps
Npu id :2
Netflow Platform Pse Policer Rate:
Ingress Policer Rate:                     133 Mbps
Npu id :3
Netflow Platform Pse Policer Rate:
Ingress Policer Rate:                     133 Mbps
RP/0/RP0/CPU0:R1#
We will come back later on this shaper since it will directly influence the netflow performance and capabilities.
Netflow principles
Netflow is a technology ratified as an IETF standards in 2004 via the RFC 3954 https://www.ietf.org/rfc/rfc3954.txt
It is used on routing devices to generate flow records from packet streams by extracting fields from sampled packets. A database, or cache, is used to store the current flows and their accounting information. Based on multiple criteria, we decide to “expire” a cache entry and generate a flow records which will be transmitted to an external collector.
The process can be described as such:
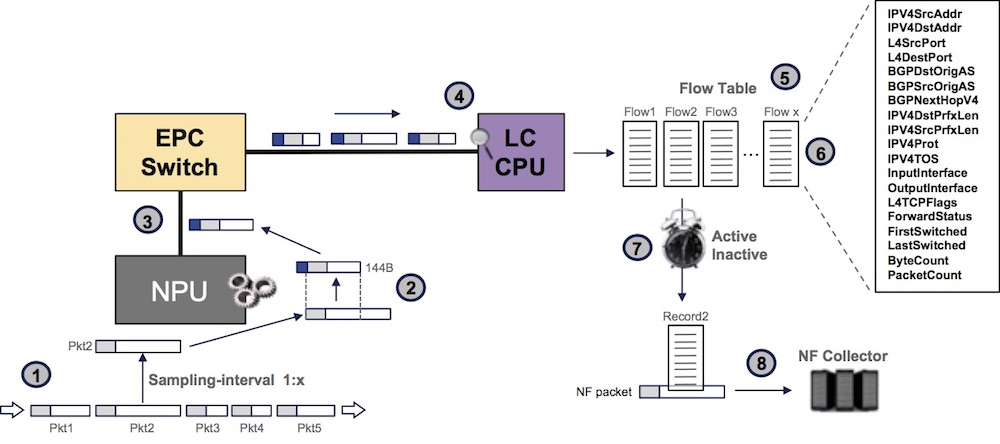
1- we sample packets (1 packet every x)
2- we pick the first 128B of the packet and add internal header (total: 144B per sampled packet)
3- this sampled packet is passed to the LC CPU via the EPC switch
4- we extract information for the IP header
5- we create cache entries representing flow accounting
6- every time a sampled packet of the same flow is received, we update the cache entry
7- we maintain multiple timers and when one expires, a NF record is generated
8- we send the record to the external collector(s)
This concept of timers is very important since it will dictate how fast we flush the cache content, and inform the remote collector of the existence of a flow. In the case of DDoS attack detection, it’s key to speed up the process:
- Inactive timer represents the time without receiving a sampled packet matching a particular cache entry.
- Active timer, in the other hand, represents the maximum time of existence of a particular cache entry, even if we still receive sampled packets matching it.
The basic configuration for Netflow:
flow monitor-map monitor1
 record ipv4
 exporter export1
 cache entries 1000000
 cache timeout active 15
 cache timeout inactive 2
 cache timeout rate-limit 2000
!
flow exporter-map export1
 version v9
  options interface-table
  options sampler-table
 !
 transport udp 9951
 source Loopback0
 destination 1.3.5.7
!
sampler-map sampler1
 random 1 out-of 4000
!
interface HundredGigE0/7/0/0
 flow ipv4 monitor monitor1 sampler sampler1 ingress
Several potential bottlenecks need to be understood when using Netflow in your networks.
- 133 Mbps or 200 Mbps shaper (not configurable)
This shaper will have a direct impact on the amount of sampled packets we can pass to the LC CPU:
133-200Mbps / [ ( packet size up to 101B + 43B ) * 8]
Ex: packets larger than 101 Bytes @ Layer2 will represent 133Mbps / (144*8) = 115,451 PPS per NPU
- Flow table size
Default 64k, configurable up to 1M per monitor-map
- Export rate-limiter
Default 2000 records / sec, configurable
Note: the export “rate-limiter” name is often creating confusion in operator’s mind because we will not “drop” records if we exceed this limit, but instead we will keep the entry longer in the cache despite the timer expiration. At the potential risk of reaching the maximum size of this cache.
Netflow processes
Several processes are involved in the Netflow operation and configuration. They are present in both Route Processor and Line Card.
RP/0/RP0/CPU0:NCS5508#show processes cpu location 0/RP0/CPU0 | include" nf"
4599     0%      0%       0% nfmgr
4890     0%      0%       0% nfma
RP/0/RP0/CPU0:NCS5508#
RP/0/RP0/CPU0:NCS5508#show processes cpu location 0/7/CPU0 | include" nf"
4036     0%      0%       0% nfma
4776     0%      0%       0% nfea
4790    12%     12%      12% nfsvr
4810     2%      2%       2% nf_producer
RP/0/RP0/CPU0:NCS5508#
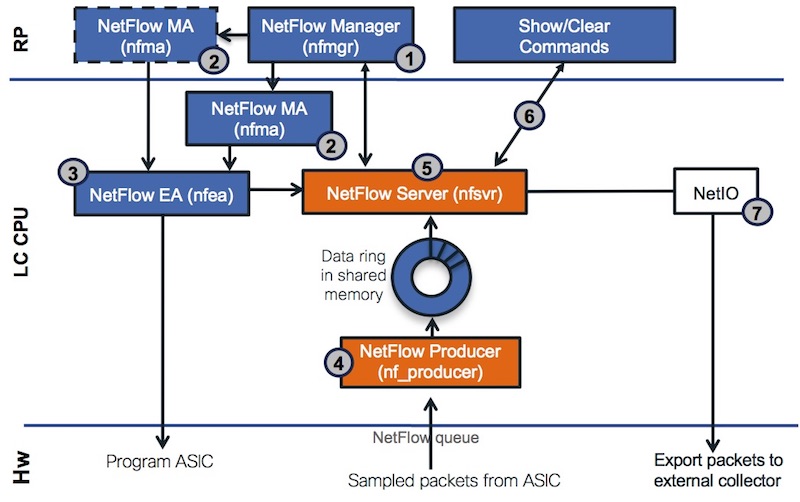
1- NetFlow Manager (nfmgr) accepts configuration and maintains global objects .i.e. sampler, flow monitor, and flow exporter
2- NetFlow MA (nfma) accepts the interface level configuration
3- NetFlow EA (nfea) sends config to NF Server and ASIC
4- NetFlow Producer receives NF packets from ASIC and adds them to the shared memory data ring for passing data to the NetFlow Server process
5- NetFlow Server (nfsvr)
- receives NF record packets from nf_producer,
- creates a new flow cache if not already created,
- or update a existing flow cache (packet / byte count) for the flow monitor,
- periodically ages entries form the NF cache into NF export packets
- sends the NF export packets to the NF collector using UDP
6- show commands are polling information for nfsvr
7- netio is used to transport the records
Measured packet sizes
“Average Internet packet size” or “IMIX packet sizes”… Those are concepts very frequently mentioned in the networking industry. It’s an important parameter when considering the forwarding performance of a device.
Indeed, the forwarding ASICs or Network Processing Units (NPUs) are often characterized by their port density or bandwidth but also by their forwarding performance expressed in PPS (packets per second). It represents the numbers of packets we can route, filter, encapsulate or decapsulate, count, police, remark, … every second. In the same vein, you may have heard about NDR (Non-Drop Rate) to express the minimal packet size a system can forward at line rate on all ports simultaneously.
Packet size, NDR, bandwidth and performance in PPS are of course directly linked to each others.
The average packet size parameter is very important to qualify the Netflow/IPFIX capability of a device and how far we can push in term of sampling-interval. It will be covered in the next part of this blog post.
So, understanding the traffic profiles and the average packet size per link and per ASIC is mandatory to qualify your network. Also it will be necessary to know precisely the port allocation to each ASIC, something we documented in this post.
You will find a large variety of answers in the litterature or when using your favorite search engine: commonly from 350 bytes to 500 bytes per packet. But the real answer should be, as usual: it depends.
Let’s take routers facing the internet and list the different types of interfaces:
- core facing
- internet: peering and PNI
- internet: transit providing a full internet view
- internet or local cache engines from various CDN
It’s fairly easy to measure it, just collect the output of a “show interface” from the router, and devide the byte counter by the packet counter.
We collected numbers from multiple ISP in the US and Western Europe, here are some numbers (expressed in Bytes)
| Peering/Transit | Ingress Avg | Egress Avg |
|---|---|---|
| Cust 1 Transit 1 | 1136 | 328 |
| Cust 1 Transit 2 | 927 | 526 |
| Cust 1 Transit 3 | 1138 | 346 |
| Cust 2 Transit | 1192 | 237 |
| Cust 3 Transit | 999 | 238 |
| Cust 4 Transit | 1249 | 202 |
| Cable Cust 1 Peering | 714 | 413 |
| Cable Cust 2 Peering | 603 | 285 |
| Cust 1 Peering | 496 | 643 |
| Cust 2 Peering | 706 | 516 |
| Cust 3 Peering | 594 | 560 |
| Peering GIX | 819 | 426 |
It seems difficult to derive a “rule” from these numbers but we can say:
- transit traffic is usually more important in ingress from 900B to 1200B average while the egress is usually shorter from 250B to 500B
- peering traffic is more balanced between ingress and egress, with an average packet size from 400B to 700B
But other type of interfaces will present more “extreme” numbers, like the CDNs (and they compose the largest and fastest growing amount of traffic in networks today).
| CDN / Content Providers | Ingress Avg | Egress Avg |
|---|---|---|
| Cust 1 Google GGC | 1277 | 329 |
| Cust 2 Google GGC | 1370 | 350 |
| Cust 3 Google GGC | 1393 | 284 |
| Cust 1 Netflix | 1495 | 73 |
| Cust 2 Netflix | 1470 | 74 |
| Cust 1 Level3 CDN | 1110 | 274 |
| Cust 2 Level3 CDN | 1378 | 176 |
| 1314 | 158 | |
| Apple | 1080 | 679 |
| EdgeCast | 1475 | 72 |
| Fastly | 1407 | 140 |
| 1416 | 232 | |
| Yahoo | 964 | 197 |
| Cust 1 Akamai | 1471 | 72 |
| Cust 2 Akamai | 1443 | 82 |
| Cust 1 Twitch | 1490 | 121 |
| Cust 2 Twitch | 1490 | 116 |
| Cust 3 Twitch | 1328 | 395 |
It’s showing very clearly that we have a very asymmetrical traffic distribution. Something totally expected considering the type of service they deliver (content). But also it’s showing that ingress traffic is very often “as large as your MTU”. It will be a key parameter when discussing the sampling-interval we have to configure on our interfaces.
I hope it convinced you that you can not simply take 350B or 500B as your average packet size. In reality, it will depend on the type on service you are connected to and the port allocation to NPUs.
Long-lived or short-lived flows?
Now that we understand the average packet size profiles for each type of services, it could be also interesting to study how long the flows last. Or to put it differently, how many packets will represent a normal / average flows before it ends.
Indeed, if we have very long streams, the cache entry will stay present for a long time and it will require the expiration of the active timer to generate a record and clear the entry. In the other hand, if we have just very short streams, very likely they will be represented by a single packet cache entry which will be flushed when we will reach the inactive timer limit.
The stress on the LC CPU will be higher if we have a larger proportion of 1-packet flows because it will imply we have to create new entries in the cache (with all the appropriate fields) instead of just updating an existing entries.
We can take a statistical approach, simply by checking the number of packets we have for each flow entry present in the cache of some real production routers.
Quick example:
RP/0/RP0/CPU0:R1#show flow monitor fmm cache match counters packets eq 1 include interface ingress location 0/1/cpu0 | utility wc -l
  65308
RP/0/RP0/CPU0:R1#show flow monitor fmm cache match counters packets neq 1 include interface ingress location 0/1/cpu0 | utility wc -l
  12498
RP/0/RP0/CPU0:R1#sh run formal | i random
Building configuration...
sampler-map SM random 1 out-of 2048
RP/0/RP0/CPU0:R1#
This output with “eq” represents the number of entries with just one packet. With “neq”, we count flows with more than one packet.
Let’s check a couple of routers using sampling-interval of 1:2048
| Router with 1:2048 | eq 1 | neq 1 | Ratio (%) |
|---|---|---|---|
| R1 0/0 | 43680 | 11122 | 75/25 |
| R2 0/0 | 39723 | 11421 | 71/29 |
| R2 0/1 | 31907 | 8628 | 73/27 |
| R2 0/2 | 35110 | 9168 | 74/26 |
| R3 0/3 | 21563 | 6541 | 70/30 |
Some other routers with a sampling-interval of 1:4000
| Router with 1:4000 | eq 1 | neq 1 | Ratio (%) |
|---|---|---|---|
| R1 | 11312 | 1725 | 85/15 |
| R2 | 56321 | 15177 | 73/27 |
We will let you run the test on your own devices, but it looks like the proportion of “1-packet flow” is more important than the others.
It appears with 1:2000 but it’s even clearer with 1:4000. It only proves that statistically, streams are less than 2000- or 4000-packets long for the most part. And that a large majority of the samples will generate new entries in the cache table instead of updating existing entries.
The flow entries will be cleared out of the cache (and will generate a NF record) when reaching the inactive timer.
New flows rate?
Another interesting question: how can I check the number of new flows per second?
With the following show command, we can monitor the Cache Hits and Cache Misses.
- Hits: every time we sample a packet and it matches an existing entry in the cache, we update the counters
- Misses: no entry in the cache for this sample, we create a new flow entry
RP/0/RP0/CPU0:R1#sh flow monitor FM cache internal loc 0/0/CPU0 | i Cache
Fri Feb  9 15:08:14.611 CET
Cache summary for Flow Monitor :
Cache size:                        1000000
Cache Hits:                           9797770256
Cache Misses:                        22580788616
Cache Overflows:                               0
Cache above hi water:                          0

RP/0/RP0/CPU0:R1#sh flow monitor FM cache internal loc 0/0/CPU0 | i Cache
Fri Feb  9 15:09:55.314 CET
Cache summary for Flow Monitor :
Cache size:                        1000000
Cache Hits:                           9798220473
Cache Misses:                        22581844681
Cache Overflows:                               0
Cache above hi water:                          0
RP/0/RP0/CPU0:R1#
Simple math now between the two measurements:
- Between the two show commands: 15:09:55.314-15:08:14.611 = (60+55)x1000+314-(14x1000+611) = 100,703 ms
- ROUND [ (22581844681-22580788616) / (100.703) ] = 10487 samples creating new flow entries / second
- ROUND [ (9798220473-9797770256) / (100.703) ] = 4471 samples with existing entries / second
Ok, that’s “interesting”, but what should I configure on my routers?
We explained the netflow principles, we detailed the internals of NCS5500 routers, reviewed the potential bottlenecks and we provided couple of data points to redefine what is an internet packet average size, the proportion of 1-packet flows in the cache, etc.
Indeed that was a lot of concepts, but what can I do more practically?
It’s time to address a common misconception and recenter the discussion. A frequent question is “what is the sampling-rate you support?”.
Since it’s the only parameter you can configure with CLI, network operators wonder what they should use but it’s inherently the wrong question.
Because the answer “1:1” could be valid.
But it doesn’t mean we can sample every single packet at every speed, on every interface, with every average packet size.
It’s capital to understand that the only relevant parameter is the number of sampled packets we can send from the NPU to the line card CPU.
This information can be easily derived from following parameters:
- average packet size (depends on the charts presented above)
- are we using ingress only or both ingress and egress (currently egress NF is not supported in NCS5500)
- how the ports configured for netflow are connected to the forwarding ASIC
- sum of bandwidth for all the ports connected to the NPU (an estimation can be taken from peak hour traffic, or the projection of growth, or even the biggest DDoS attack)
- and finally, the sampling-interval we configured

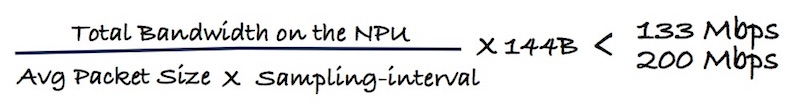
If we take the assumption that sampled packets will be mostly larger than 101B, we will transport 144B packets to the CPU. This traffic will be rate-limited by the shaper we mentioned above: 133Mbps or 200Mbps depending on the platform:
Something we can not really anticipate is the ratio of sampled packets that will be <101B. But this number will not represent much, except in case of specific DDoS attack.
Let’s take a couple of examples to illustrate the formulas above:
- you have 6 ports on the Jericho NPU but only 4 are used with Netflow
- the average packet size on this ports connected to CDN is 1400B
- the load is heavy and the ports are used at 70% total, at peak hour
- but the customer would like to anticipate the worst case if all ports are transmitting line rate So the math will be:
Most aggressive sampling-interval = Total-BW / ( Avg-Pkt-Size x 133Mbps ) x ( 144 x 8 ) = 400,000,000,000 / ( 1400 x 8 x 133,000,000 ) x ( 144 x 8 ) = 309
–> in this example, it will be possible to use an 1:309 sampling-interval before reaching the limit of the 133Mbps shaper.
Another example:
- you have 9 ports on the Jericho NPU+ all configured for NFv9
- the average packet size on this ports connected to peering partners is 800B
- the load not huge and the ports are used at a total of 40% at peak hour
- but the customer takes some margin of growth (and error) and pick 70% That gives us:
Most aggressive sampling-interval = Total-BW / ( Avg-Pkt-Size x 133Mbps ) x ( 144 x 8 ) = 900,000,000,000 x 0.7 / ( 800 x 8 x 133,000,000 ) x ( 144 x 8 ) = 852
–> in this example, it will be possible to use an 1:852 sampling-interval before reaching the limit of the 133Mbps shaper.
To check if your sampling is too aggressive and you are hitting the shaper limit, you need to look at the droppedPkts count of the VOQ24 / COS2 in the following show command:
RP/0/RP0/CPU0:5508-6.3.2#sh controllers npu stats voq base 24 instance 0 location 0/7/CPU0

Asic Instance     =            0
VOQ Base          =           24
       ReceivedPkts    ReceivedBytes   DroppedPkts     DroppedBytes
-------------------------------------------------------------------
COS0 = 0               0               0               0
COS1 = 0               0               0               0
COS2 = 904365472       90918812004     3070488403      308867834524
COS3 = 14              1668            0               0
COS4 = 1955            201438          0               0
COS5 = 0               0               0               0
COS6 = 0               0               0               0
COS7 = 0               0               0               0
RP/0/RP0/CPU0:5508-6.3.2#
Having this COS 2 DroppedPkts counter increasing is the proof we are exceeding the shaper and you need to reduce the sampling-interval. The “instance” here represents the NPU ASIC.
Note: In releases before 6.3.x, Netflow was transported over VOQ 32 / COS3 so the CLI to use was “sh controllers npu stats voq base 32 instance 0 location 0/7/CPU0”
Conclusion
We hope this article helped provided useful information on the nature of packets and streams in Internet. Also, we hope we clarified some key concepts related to netflow v9 on NCS5500.
Particularly, the notion of “interval-rate” should be considered irrelevant if we don’t specify the traffic more precisely.
In a follow up post, we will perform stress and performance testing on Netflow to illustrate all this. Stay tuned.
Acknowledgements: Thanks a lot to the following engineers who helped preparing this article. Benoit Mercier des Rochettes, Thierry Quiniou, Serge Krier, Frederic Cuiller, Hari Baskar Sivasamy, Jisu Bhattacharya
Leave a Comment